Journal — StormNet
The Clemson ice-storm field test
Two consumer devices recorded pressure and audio features during a January 2026 storm. Here is the setup, the reported analysis, and the next test.
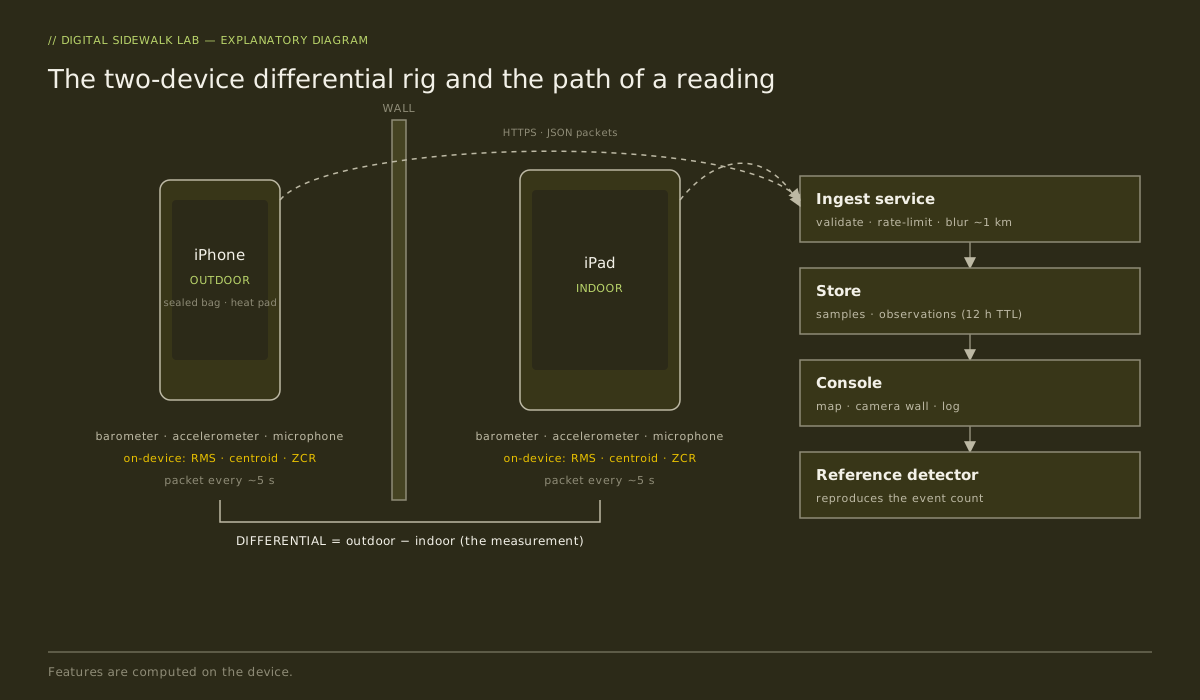
Could consumer devices record useful changes during a precipitation event at one house? In January 2026 I built a sensor app and ingest service, placed an iPhone outdoors and an iPad indoors, and used them during an ice storm in Clemson, South Carolina.
The field test produced an exported dataset and a practical account of running the devices through changing conditions. The next task is to make that record reproducible and determine which observations remain useful across more devices and events.
The setup
The project record describes an iOS app built with React Native and Expo. It sampled the devices' barometers and accelerometers and computed microphone features on the device: root-mean-square level, spectral centroid, and zero-crossing rate. These summarize aspects of signal level, frequency distribution, and sign changes. The app sent feature packets to an ingest service at a nominal interval of roughly five seconds.
The intended collection path kept raw microphone audio on the device. Separately, my field notes describe a short voice memo used to document conditions; that recording is a different artifact from the feature stream.
The outdoor device was an iPhone 13 Pro Max near a door, inside a freezer bag. The indoor device was an iPad Pro 11-inch. The outdoor phone stopped during the event and was restarted with a changed placement, heat blanket, and external power. The fieldwork account describes that intervention.
The pair was intended to support an indoor/outdoor comparison. Different devices and placements mean that subtracting their readings does not automatically isolate a weather effect.
What the working analysis reported
The January 26 analysis recorded these figures:
- 23,451 samples across approximately 17.5 hours.
- A barometric drop of approximately 10.8 hectopascals.
- 82 outdoor audio events above the analysis's chosen baseline and threshold.
- Outdoor spectral-centroid values around 3,500–3,900 hertz during intervals manually tagged as sleet or ice.
These figures are attributed to that working analysis. They have not been recomputed for this journal revision. A reproducible release needs to define what a sample represents, separate the device streams, identify gaps, and show the calculation behind each reported quantity.
What the record can support
The analysis suggests an association between changes in the recorded audio features and the observer's precipitation tags. It does not establish a weather forecast or a general precipitation classifier.
The microphones were uncalibrated, the device clocks and barometers were not independently checked for this account, and the labels came from one observer at one site. The outdoor placement changed, and the event threshold was selected after the data existed. These are the conditions a reproduction must carry forward, rather than remove from the description.
From a field file to a reusable source
The dataset illustrates what the map needs to preserve: a value, time, location precision, source device, processing history, and quality information. A future radio segment could use an approved recording or a human explanation of those observations. A numeric feature stream and an audio recording would remain distinct sources, each with its own permitted use.
The project account describes a prepared release, with CC BY 4.0 intended for the dataset and Apache 2.0 for the platform and reference-detector code. Public download links are pending. Before extending the field season, the priorities are to reproduce the reported analysis, document the detection rule, and test the collection process at another site. Calibration work should then evaluate whether corrections improve comparisons between devices.