Journal — Method
A useful map explains its gaps
The observation schema records where information came from, what it represents, and why it may be unavailable.
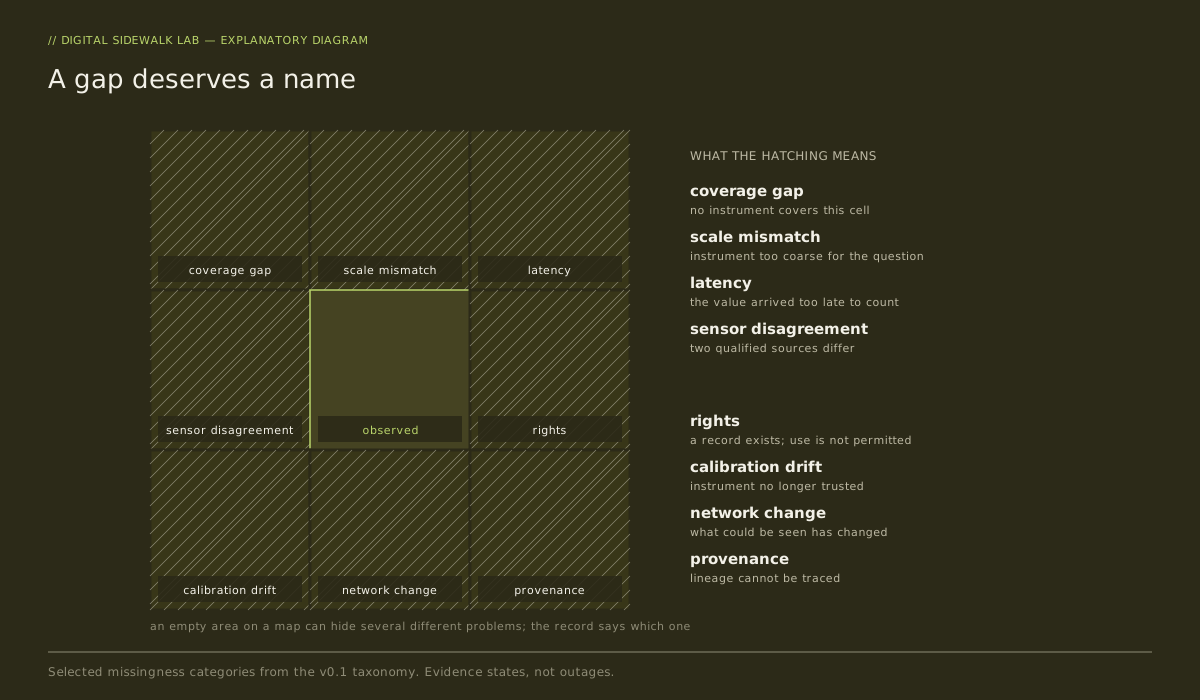
An empty space on a map can mean several things. No instrument covers it. A source is late. A reading applies to too large an area. Information exists, but its permitted use does not include this display. Those conditions call for different responses.
The August 2026 observation-schema archive makes those distinctions part of the record. It defines how a source, an observation, and an event should be described before they are combined in a map or analysis.
What one record carries
An observation includes an identifier and schema version, a variable and unit, the time it applies to, its geographic footprint, its source, processing history, quality information, and permitted use. It also identifies the kind of information being recorded: a measurement, a derived value, a model output, a forecast, a human report, or another stated class.
A common structure makes records easier to inspect together. Their labels and context determine whether a particular comparison is appropriate. A regional forecast and a phone measurement can appear in the same interface without being presented as interchangeable evidence.
Recording the reason for a gap
The archive identifies coverage gaps, scale mismatch, disagreement, calibration drift, changing networks, delays, uncertain references, missing provenance, and rights restrictions. These labels give a user a reason for an absent or questionable value.
Consider two sources that disagree. Keeping their times, footprints, and device information may reveal that they measured different conditions. Combining them into an unexplained average would lose the information needed to investigate.
Historical comparisons need the same care. A network with more instruments may detect more events even if the underlying activity has not increased. Changes in coverage belong beside the observations.
What this enables
For the Gravel9 Master Map, the schema offers a way to show both available information and the limits of its coverage. For future programming, it offers the source information a human host needs before describing a place or a change.
The archive also proposes recording what additional observation would help resolve an uncertainty. The observation-design instrument develops that question further.